Space Weather
The Sun is the centre of our solar system and the source of energy for life on Earth. 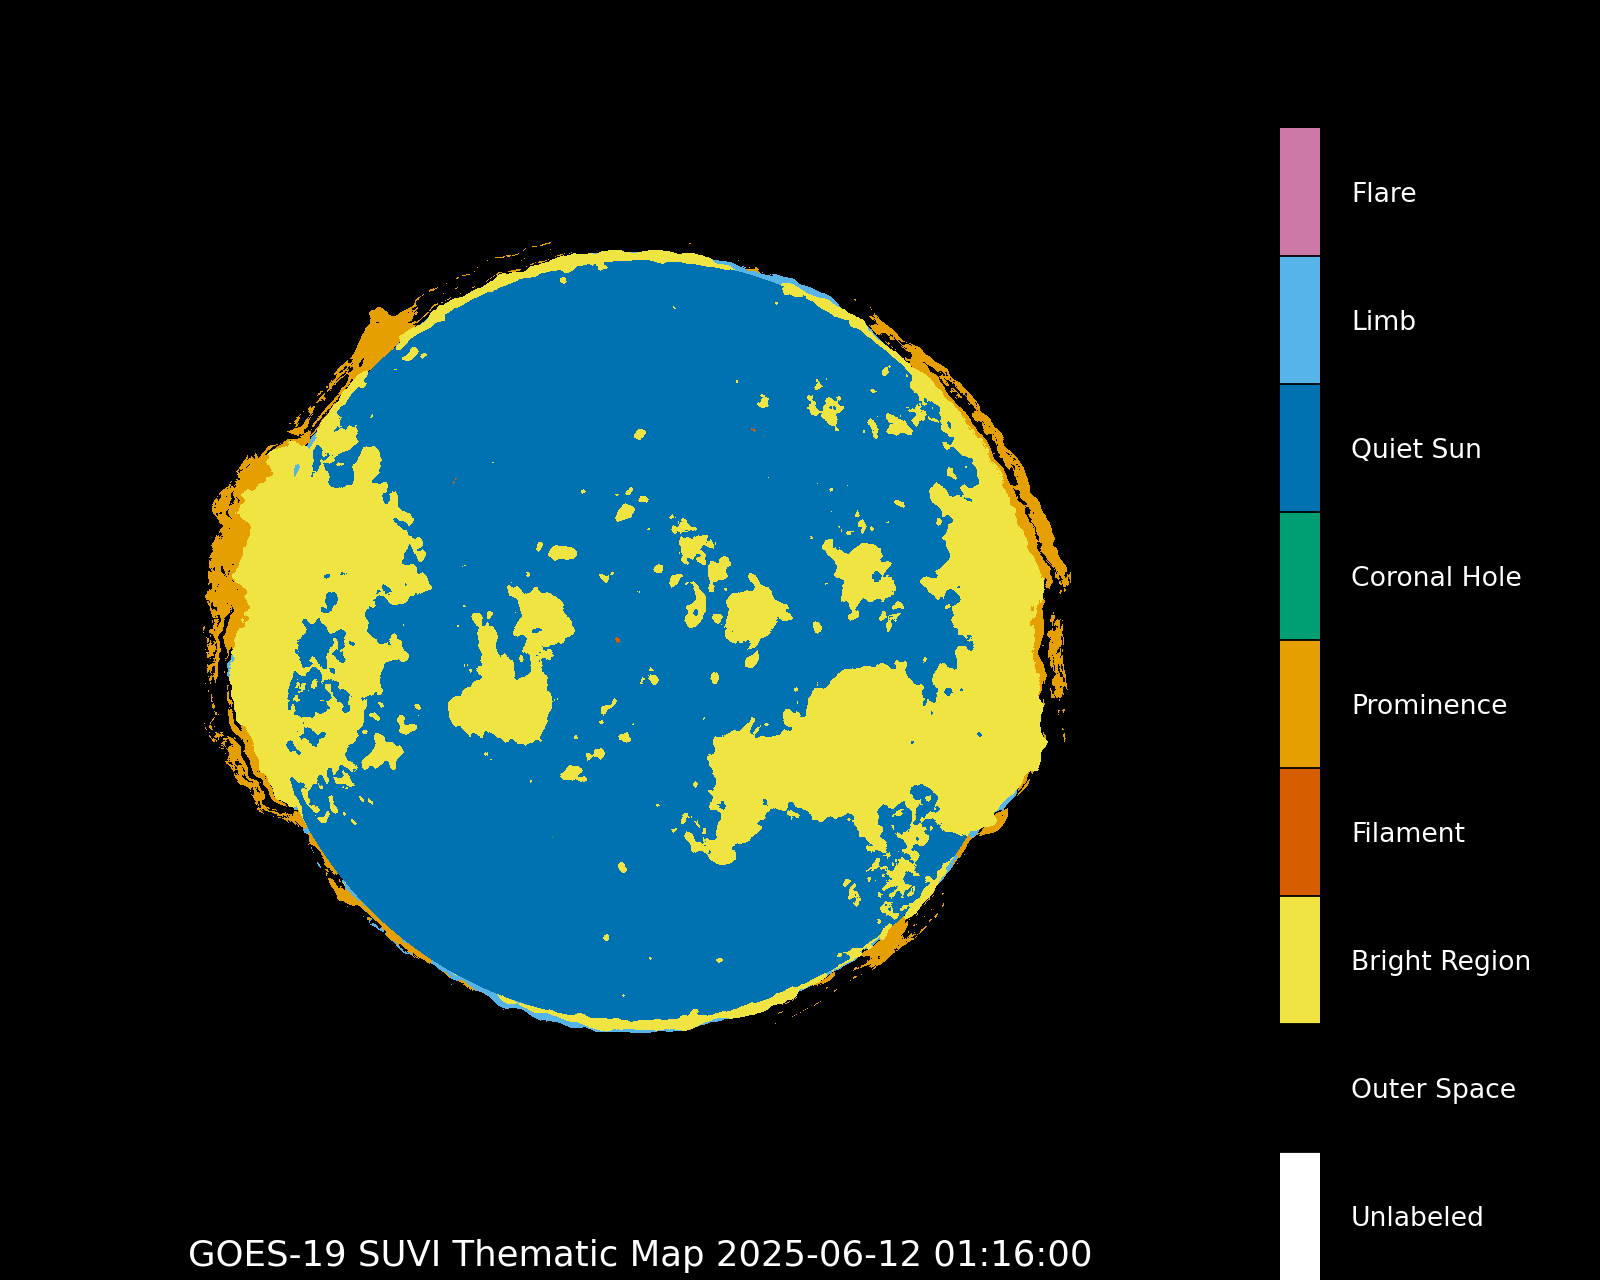 With its thermonuclear fusion in its core, it dissipates particular and electromagnetic radiation. The Sun with its radiation, also called the solar wind, have an enormous effect on the Earth. The solar wind can affect different technologies on Earth, like degrade or block high-frequency radio waves, penetrate satellite electronics and cause an electrical failure, degrade power grid operations or produce the aurora borealis.
The interaction between the solar wind and Earth’s magnetic field and the influence of the underlying atmosphere and ionosphere creates various regions of fields, plasmas, and currents inside the magnetosphere such as the plasmasphere, the ring current, and radiation belts. The consequence is that conditions inside the magnetosphere are highly dynamic and create what we call “space weather”. That can affect technological systems and human activities.
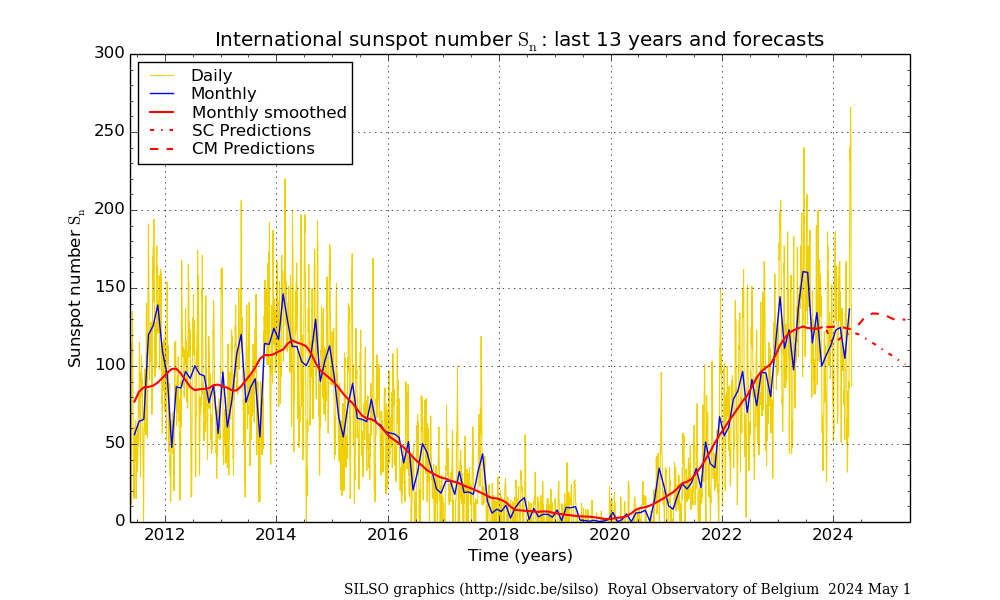
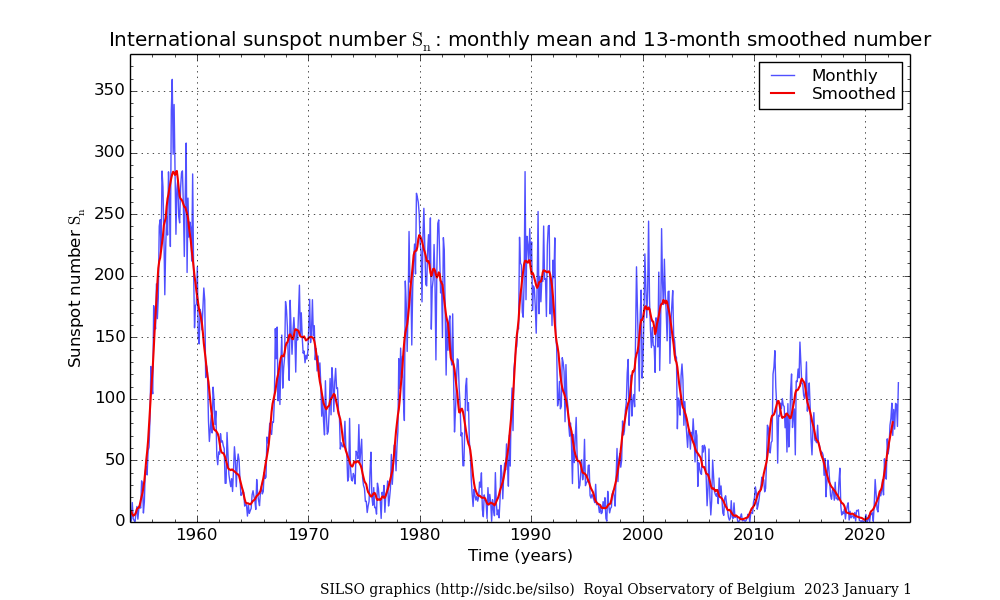
Sunspots are an area seen as a dark spot, in contrast with its surroundings, on the photosphere of the Sun. The sunspot number is the daily index of sunspot activity. The sunspot cycle is the approximately 11-year quasi-periodic variation in the sunspot number. The polarity pattern of the magnetic field reverses with each cycle. The number of sunspots has a major effect on shortwave, mediumwave and VHF communication.


AURORA BOREALIS

The OVATION (Oval Variation, Assessment, Tracking, Intensity, and Online Nowcasting) model is an empirical model of the intensity of the aurora developed at the Johns Hopkins University, Applied Physics Lab by Patrick Newell and co-workers. The model uses solar wind and interplanetary magnetic field (IMF) conditions at the L1 point, upstream of Earth towards the sun, as inputs. The model produces an estimate of the intensity of the auroral energy at locations on Earth.
The OVATION Aurora Forecast Model shows the intensity and location of the aurora predicted for the time shown at the top of the map.